Reports
Summary report
Totals for the period grouped by client, project, user or task, with hours and money.
Applies to:
Everyone
Analytics → Reports → Summary Report rolls the period up into one row per client, project, user or task. Users see their own time; report-permission holders see everyone's.
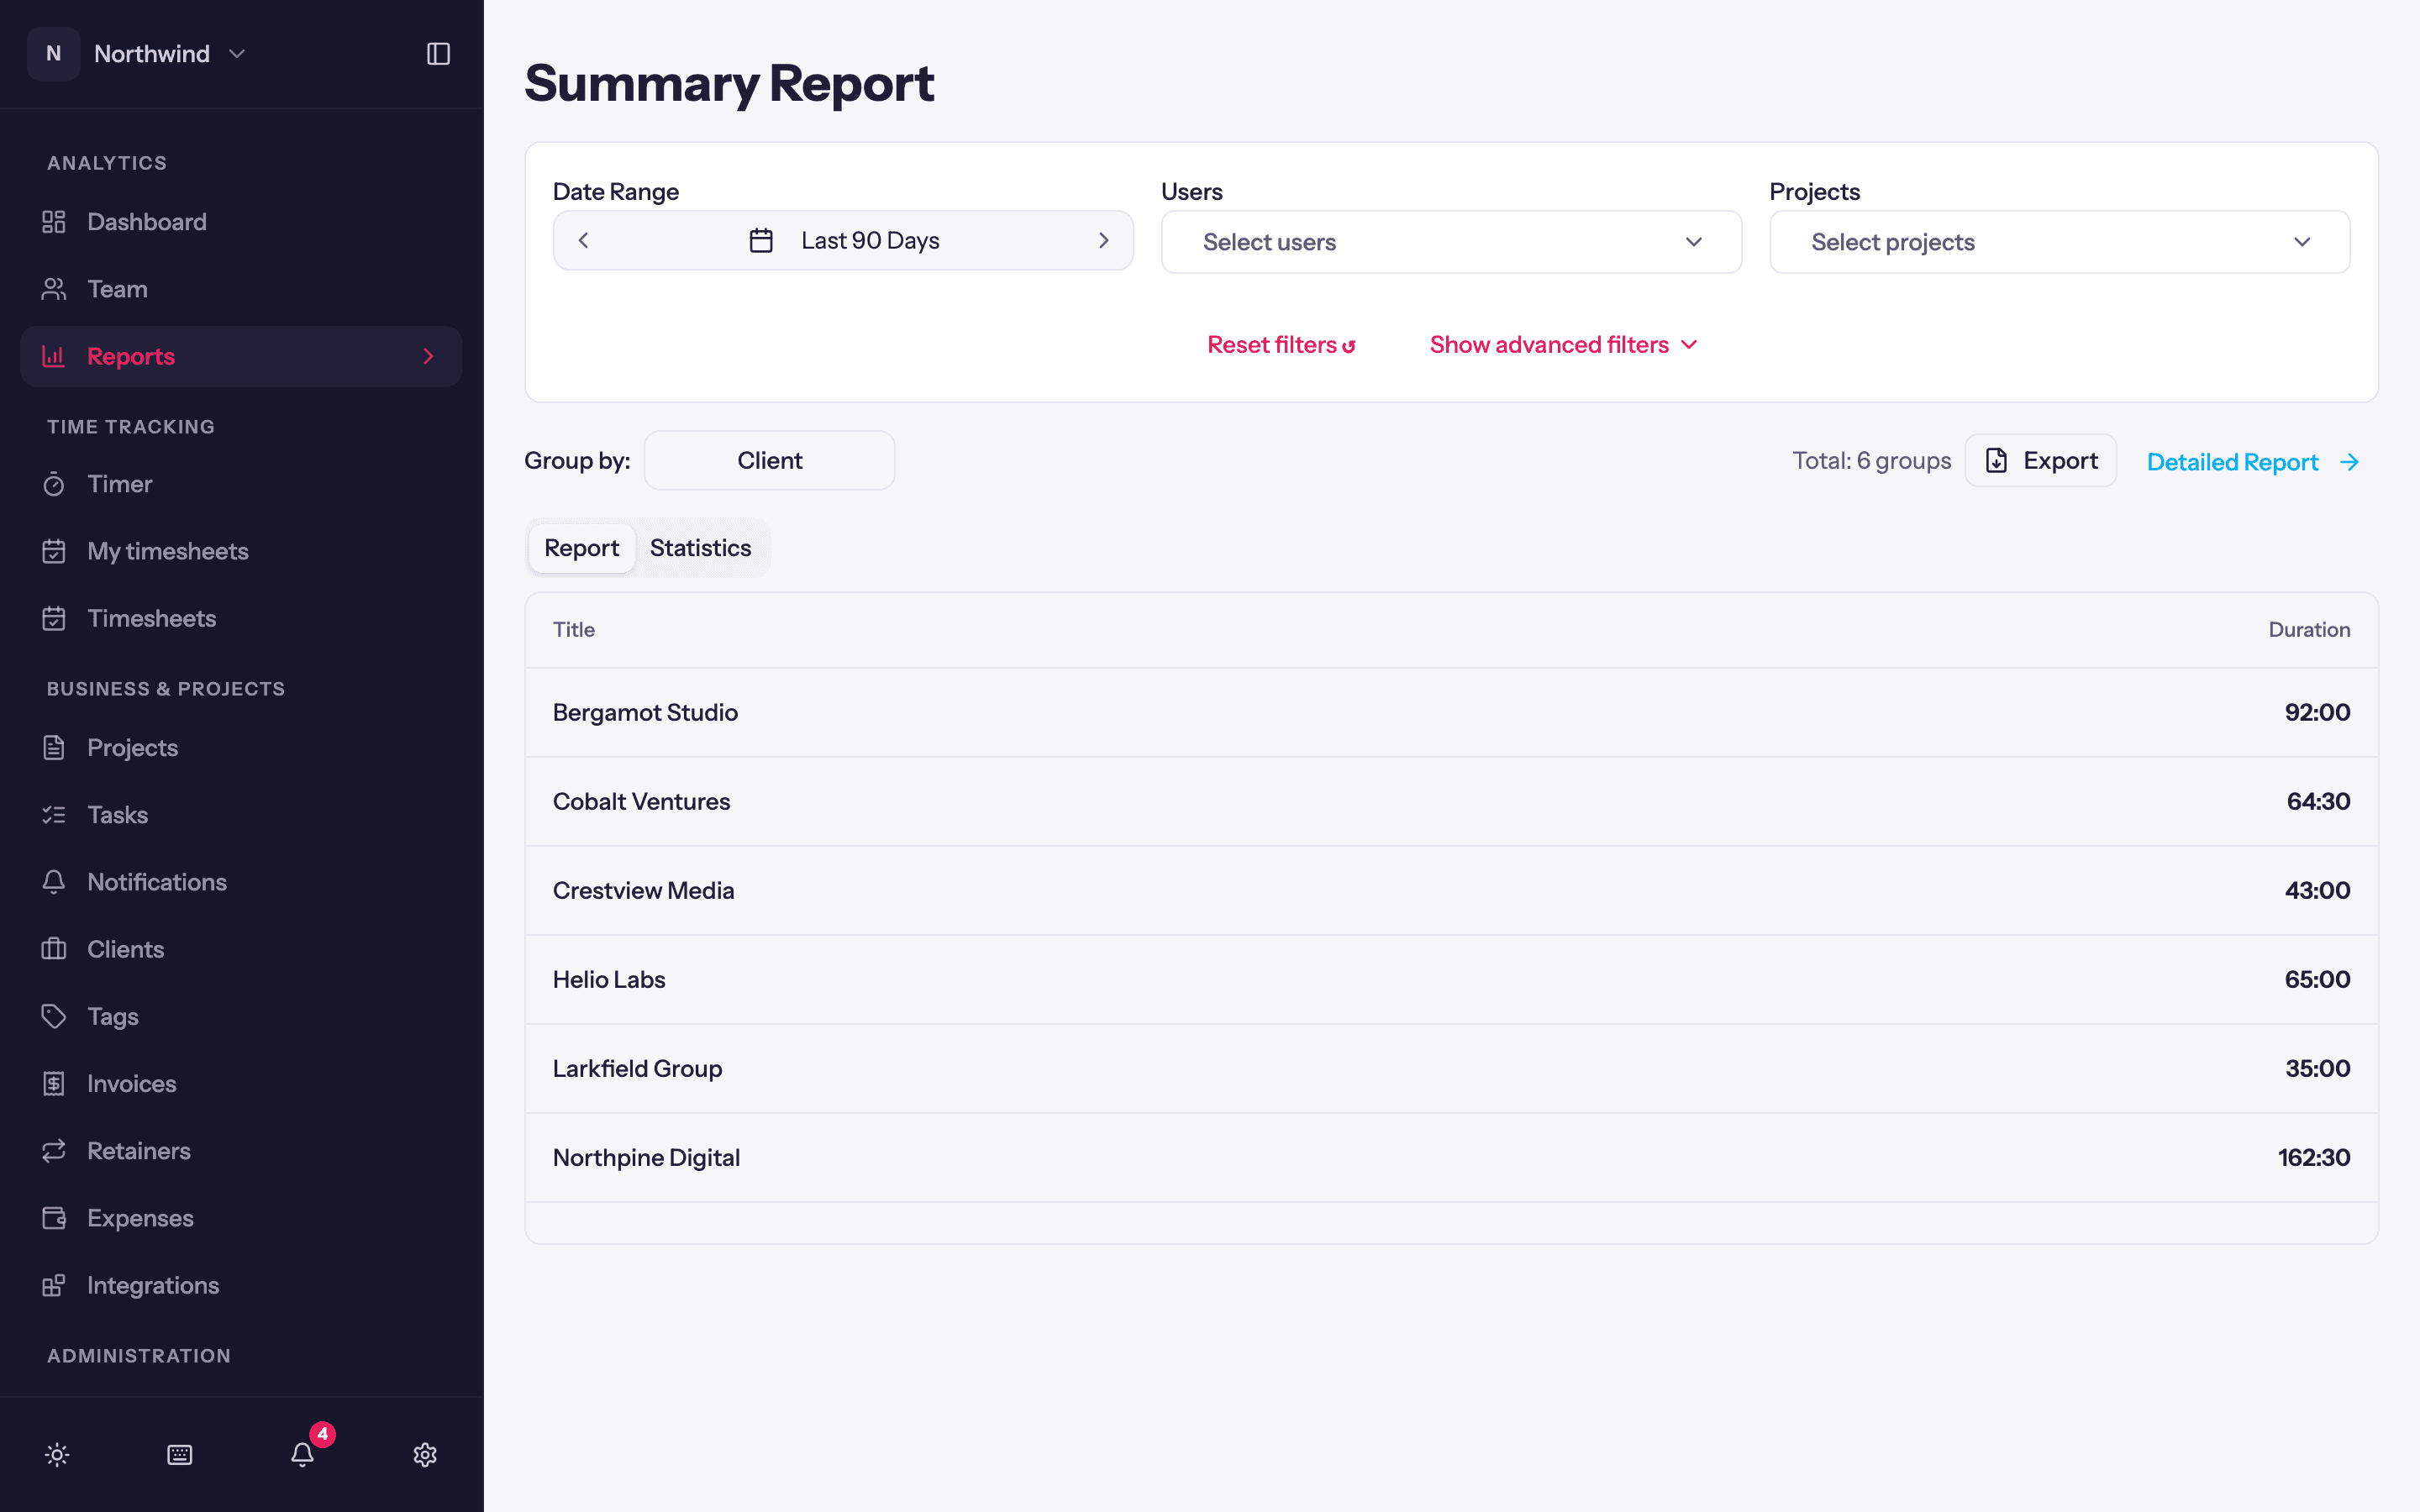
Controls
- Date Range and the arrows.
- Users and Projects multi-selects, plus Show advanced filters for Clients, Tasks, Tags, Currencies, and Billable / Non-billable, Invoiced / Uninvoiced switches. Reset filters ↺ clears the lot.
- Group by: Client, Project, User or Task.
- Hide revenue numbers.
- Export downloads the table.
- Detailed Report jumps to the entry-level report with the same filters applied.
Reading it
Each row shows the group's Duration and, for report-permission holders, its billable amount, cost and profit. Click a column header to sort. The chart above the table shows Hours by Week or Month for the period, with a Full breakdown you can expand.
Typical uses
- Monthly client review: last month, group by Client.
- Who did what on a project: filter to the project, group by User.
- Where a person's week went: filter to the user, group by Project or Task.